

not logged in | [Login]
![]()
This module allows comparing different heating scenarios. The module is not integrated into the Hotmaps Toolbox, but it is provided as a separate Excel workbook that combines the results of other calculation modules to be previously run. The template as it is allows comparing up to 9 different scenarios, but if properly adapted, it can work for any number of scenarios. Separate worksheets are set up to collate the key indicators from each calculation module, while key indicators are automatically collated in the final table and represented in graphs.
SCENARIO ASSESSMENT WORKBOOK: CLICK HERE TO DOWNLOAD
The approach to assessing a number of different heating scenarios follows this sequence of calculations:
In each scenario, a certain portion of heating is assumed to be provided through decentral heating and another through district heating. For instance, a sensitivity analysis for a set of different district heating systems, with different penetration levels and different centralised heating supply technologies that may vary by the capacity of the energy generators could be built upon one common business case of decentral heating with certain fixed supply options. Viceversa, other sensitivity assessments could be run with one centralised heat supply scenario, investigating the impact of the different decentralised technologies, or with any other combination of scenarios.
The user runs independently all the calculations modules for each scenario under consideration, reports the results in the relevant sheet of Excel Workbook, and then compares them.
The inputs compiled in the scenario assessment Workbook are produced by the following calculation modules:
1. CM - Decentral heating supply
2. CM - District heating supply dispatch
3. CM - District heating potential: economic assessment
The input and output of these modules should be saved for each scenario and then compiled in the scenario assessment workbook. The cells to be filled are properly marked and a colour-coding legend is reported on the first sheet of the workbook, as explained in the following paragraph Interpretation of input parameters. The three above-mentioned calculation modules, require some inputs that you may already have, or that you may have to calculate running other modules, as specified in the following paragraph as well as in the Training section.
The sheet "Final Tabel" calculates and shows a comparison of these indicators both in the figures and charts for each scenario:
For each scenario, the following indicators are shown in the form of a stacked bar chart:
The input parameters needed to run this module are divided into:
On top of these, the workbook has instructions in red text and additional calculations that should not be edited in grey cells. The picture below shows how the colour-coding indicated on the front sheet of the workbook looks like.
This sheet mainly shows the overall output parameters both in figures and charts, and it has few input parameters.
A Scenarios Table (R4:Z17) is ready to be filled with a short description of the different scenarios object of the assessment. Placed right above the charts, this table can be a reminder for the user or clarification for other collaborators.
Further down in the sheet there are some parameters that have already been filled out, but can be adjusted, as long as they are not left empty:
This set of three tabs is used to build the building stock that will be used as an input parameter to calculate the output of the decentral heating supply. Please visit the CM - Decentral heating supply page for a deeper understanding of how the building stock feeds into that module.
Single-family building stock The worksheet as it is offers to structure a building stock for single-family houses of two different types: each column is dedicated to a building type and the CM - Decentral heating supply should be run once per each type. However, the user can adapt the Workbook in order to combine any number of different building categories (e.g. per age, gross floor area, category, etc.).
Multi-family building stock The worksheet as it is offers to structure a building stock for multi-family houses of eight different types: each column is dedicated to a building type and the CM - Decentral heating supply should be run once per each type. However, the user can adapt the Workbook in order to combine any number of different building categories (e.g. per age, gross floor area, category, etc.).
In this sheet, the input to enter is the Heat demand total (Final Energy) for the selected area and the Share of building type on the total useful energy demand for heat in 2050 per each type of building. The template offers a set of 10 different types of building, per category and age. The user can adjust the parameters of the building types, as well as the total number of building types combined at this stage, and the Share of total useful heat demand in the building type supplied by the different individual heating technologies.
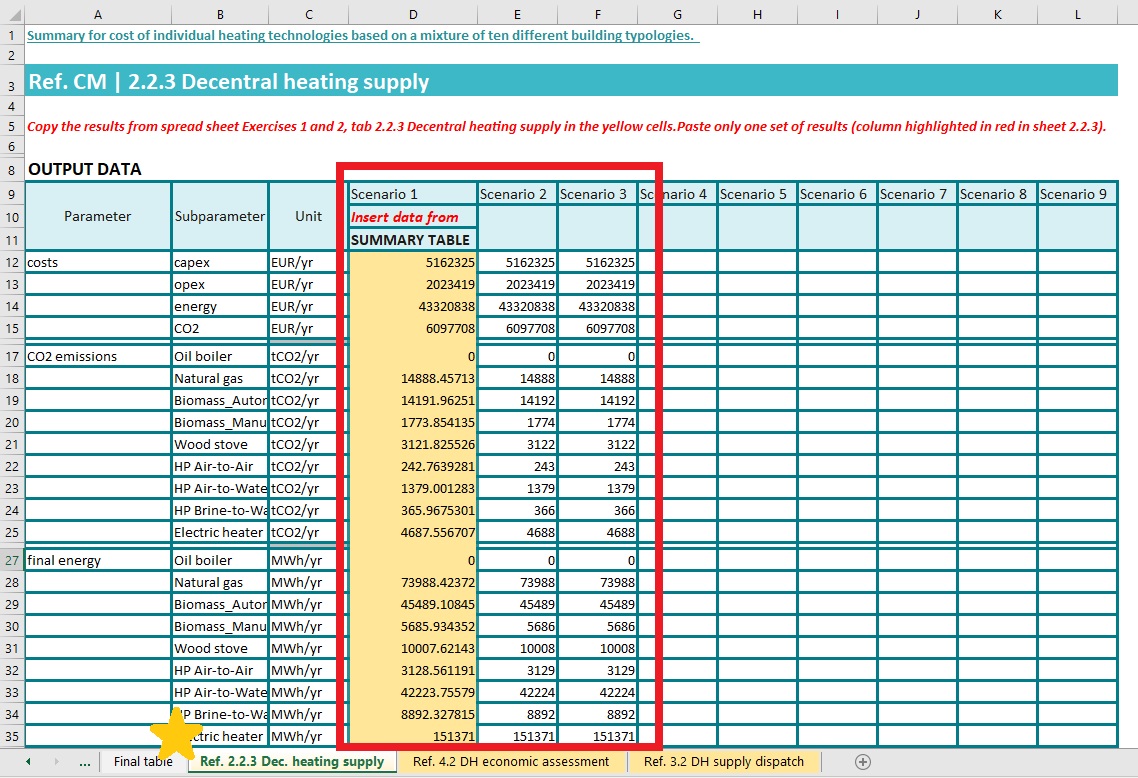
The output of the previous sheet Decentral heating supply, shown in fields highlighted in red, is to be copied and pasted in this sheet in the yellow fields. This sheet is meant to combine a number of decentral heating scenarios that will be considered for the portion of decentral heating in each one of the scenarios assessed in the Final Table. So for instance, if the sensitivity analysis builds on one fixed decentral heating scenario and evaluates the impact of nine levels of penetration of district heating, then the previous steps should be carried out only once and the Decentral heating supply outcome should be pasted in all the nine columns of this sheet. Conversely, if different decentral heating scenarios are compared, the three steps previously described should be repeated for each one.
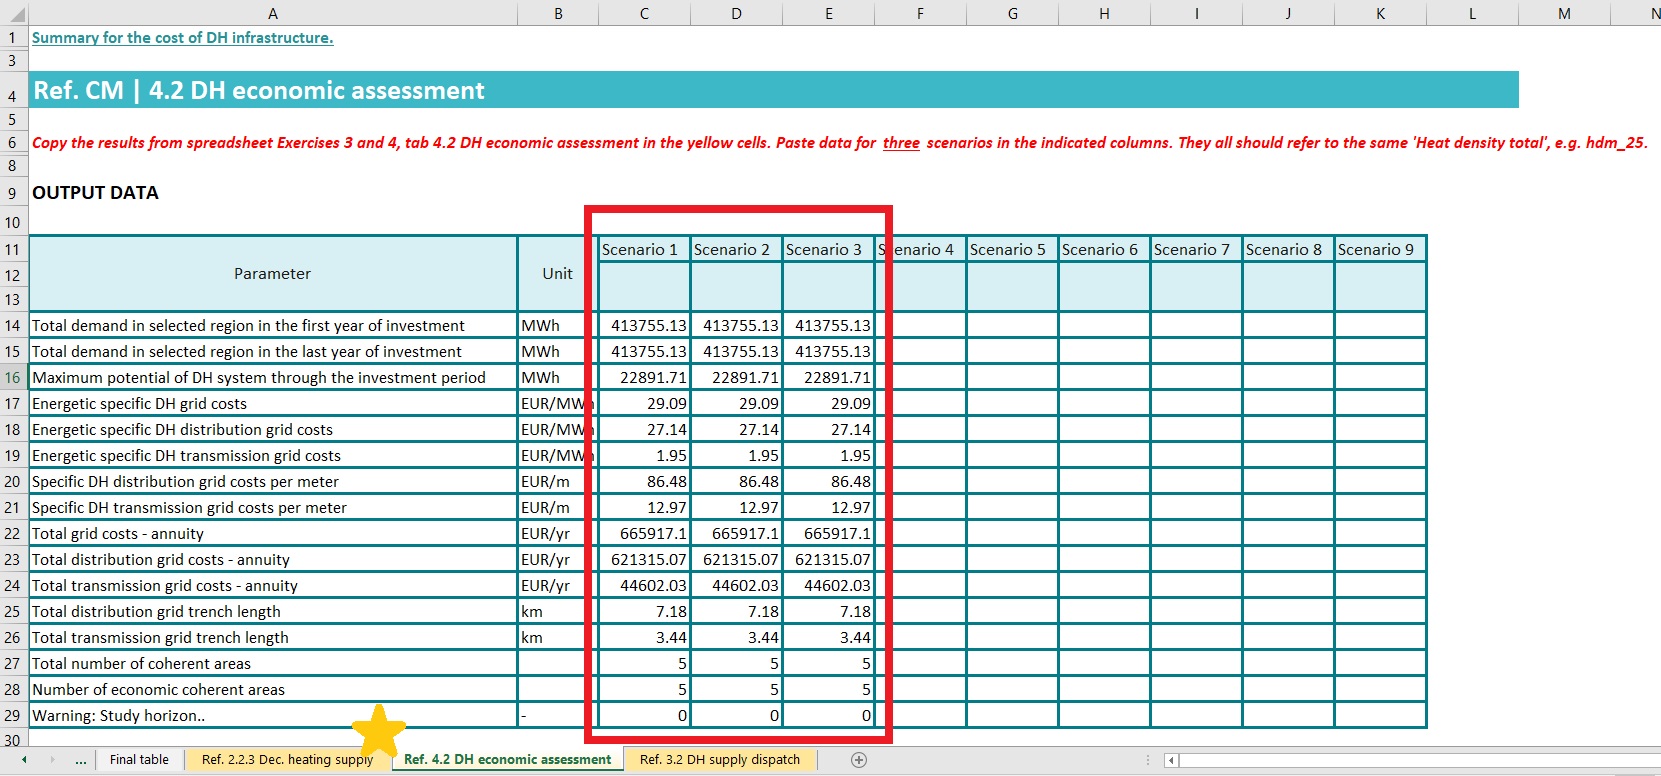
The input used to run several scenarios of the CM DH Economic Assessment are to be written in the blue cells, and each run's output is to be pasted in the yellow fields. This sheet is also meant to combine a number of decentral heating scenarios that will be considered for the portion of decentral heating in each one of the scenarios assessed in the Final Table but in relation to the economic assessment and costs. As for the previous sheet, if the sensitivity analysis builds on one fixed decentral heating scenario and evaluates the impact of nine levels of penetration of district heating, then the Decentral Heating Economics Assessment outcome should be pasted in all the nine columns of this sheet. Conversely, if different decentral heating scenarios are compared, a separate run of the Calculation module should be complete for each scenario.
The input used to run several scenarios of the CM DH Supply Dispatch are to be written in the blue cells, and each run's output is to be pasted in the yellow fields. This sheet is also meant to combine a number of decentral heating scenarios that will be considered for the portion of decentral heating in each one of the scenarios assessed in the Final Table. As for the previous sheet, if the sensitivity analysis builds on one fixed decentral heating scenario and evaluates the impact of nine levels of penetration of district heating, then the Decentral Heating Economics Assessment outcome should be pasted in all the nine columns of this sheet. Conversely, if different decentral heating scenarios are compared, a separate run of the Calculation module should be complete for each scenario.
After copying your results from the three modules: Decentral heating supply, district heating economic assessment and district heating supply dispatch to the corresponding sheets you will get whole scenario results in the final table sheet for your evaluated area.
The large diagram under Output data in the Final table sheet shows the results of these overall scenarios collected. The presented results can be divided into various categories. Costs, emissions, absolute energy as well as shares in the overall system are among them.
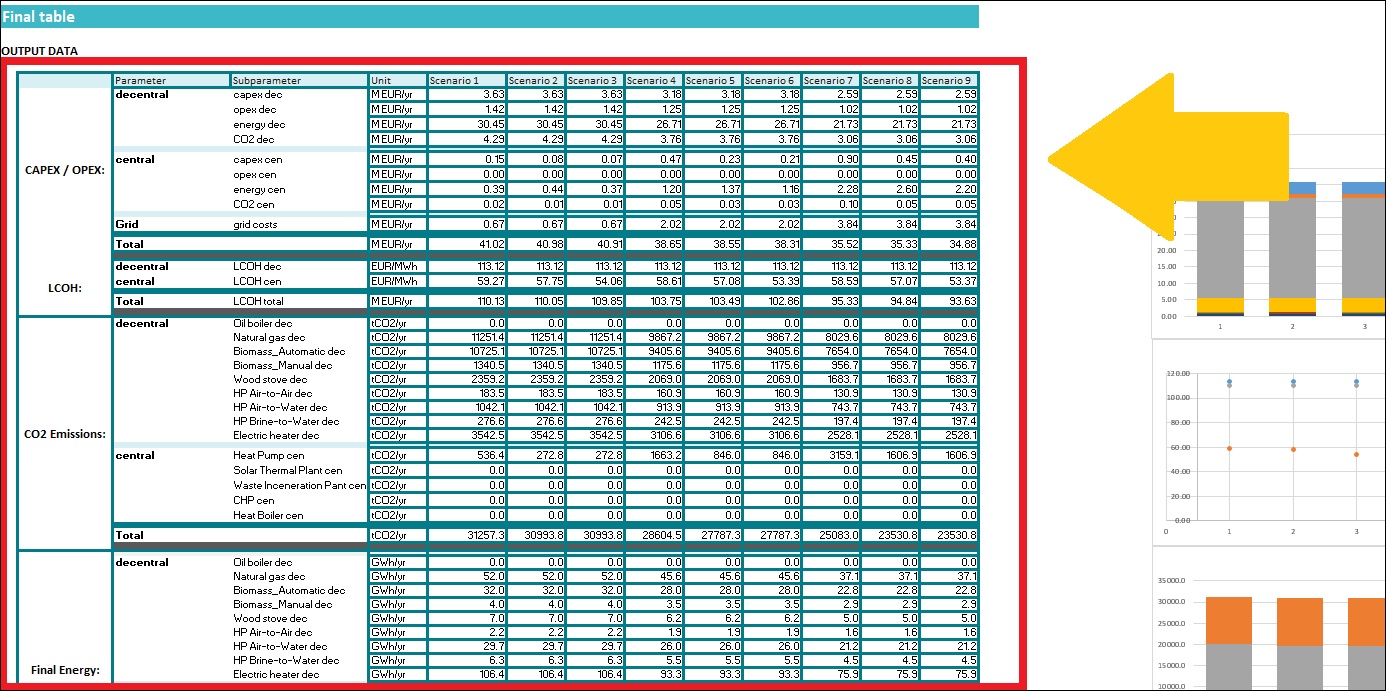 In general, all these results are individually calculated for the decentral as well as the area supplied with central heat and are applied to the overall scenario using their respective shares. They are therefore listed separately as individual components of the respective parameter.
The scenario assessment file offers two different costs which can be further analysed. The CAPEX/OPEX represent the annual absolute costs of the system. They are further subdivided into the shares of the decentralized-, centralized generation of heat and the share of the grid, which represents the distribution costs of the central heat. Taken together they make up the total costs of the respective scenario. These costs are represented in the Costs in M EUR/yr plot to the right of the table.
The second cost parameter which is provided are the LCOH (levelized costs of heat) which describes how much the supply costs per amount of energy. The division into decentralized, centralized, and total LCOH allows an interpretation of the two components and relation to the total system. This can also be done in the LCOH in EUR/MWh diagram on the right.
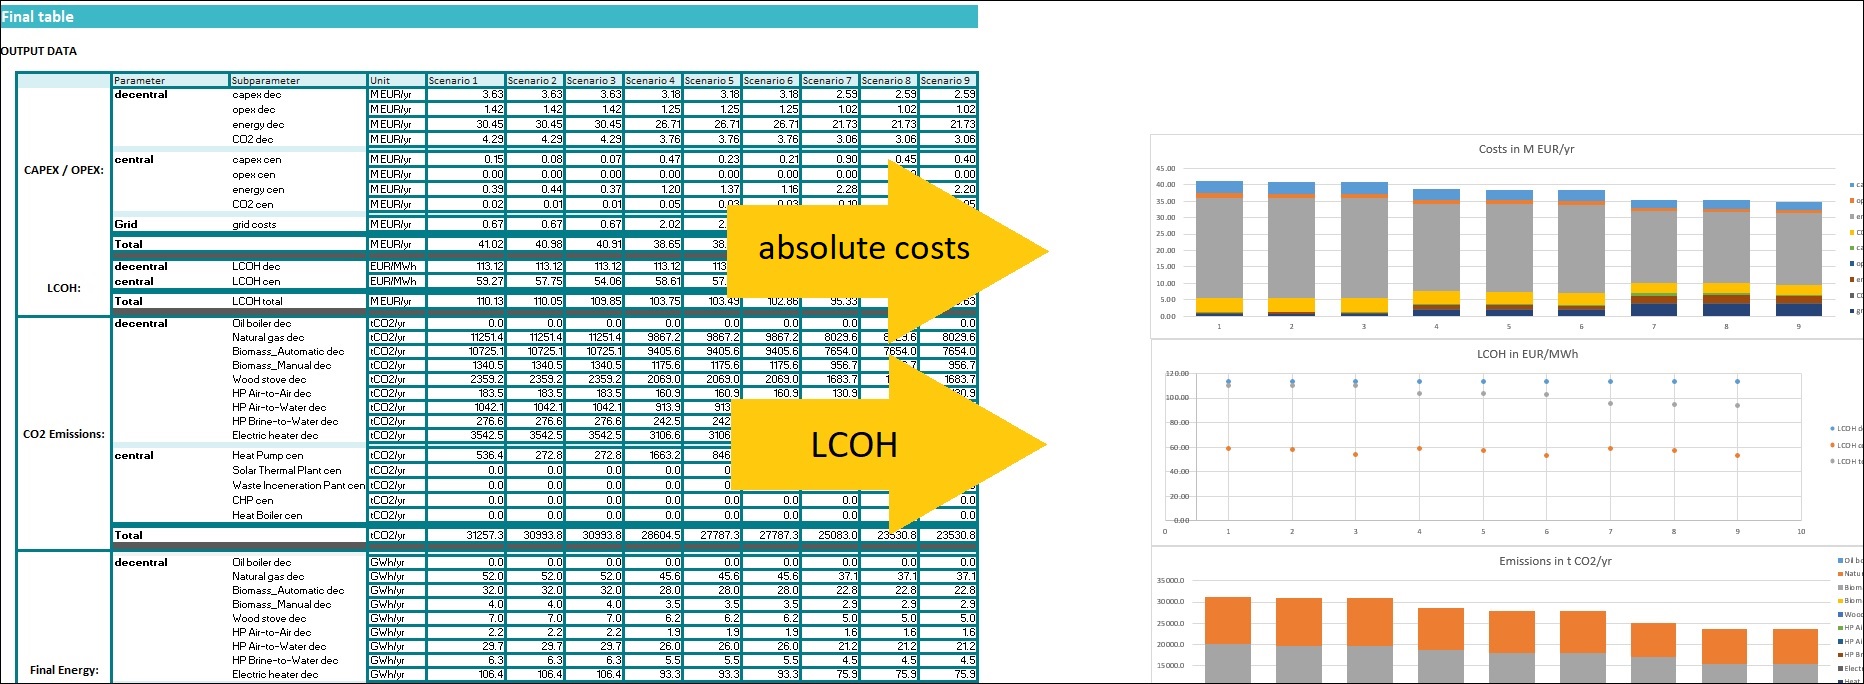
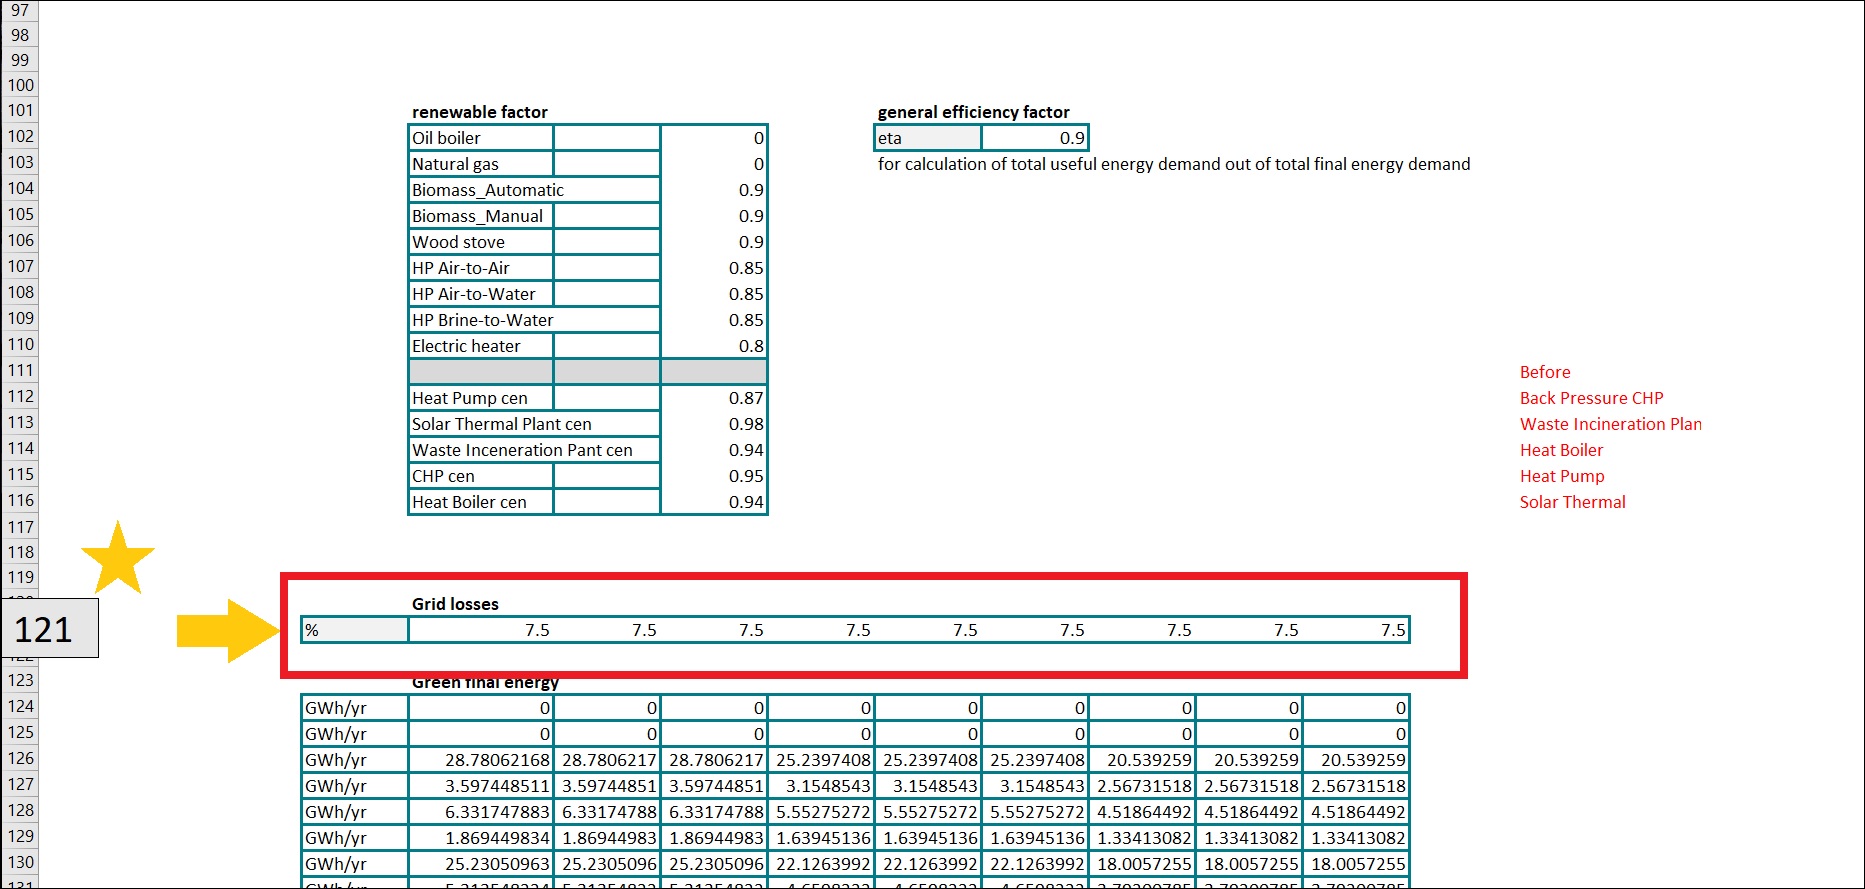
To be able to compare the emissions of different scenarios, they are calculated under CO2 emissions. They are divided into centralized and decentralized scenarios, which in turn are divided into the technologies used. This allows a precise analysis on a technology level to evaluate them among each other or to identify large sources. Regarding central emissions, the additional emissions are also included here, which occur due to the distribution line losses. They can be adjusted in line 121, under Grid losses.
 Also, there is again a diagram which shows the emissions of the different scenarios. (Emissions in t CO2/yr)
To compare the energy shares of the individual scenarios, the entries Final Energy and Useful Energy are suitable. Final Energy refers to the necessary use of energy sources to achieve useful energy with the technologies used and their efficiency. In relation to centralized, the line losses are also included here. A comparison of the final energy of the individual scenarios is again right beside the table in the diagram final energy in GWh/yr. The portion of final energy which is available after final conversion to the consumer for the respective use is called useful energy. The parts from the different technologies are shown under in the table under useful energy or in the diagram useful energy in GWh/yr on the right side.
Finally, the document offers a comparison of four different shares.
Three of them are renewable shares. In the table renewable factor below, you can indicate factors for different technologies. We have provided default values here, but these can be changed as desired.
The fourth share describes the portion from final energy supplied by district heating the whole system final energy.
All the shares can be found in the graphic Shares in % to the right of the table.

(Tomaszów Mazowiecki)
With the download of the Excel file, you will receive a ready-to-fill version of the scenario assessment. After a successful calculation of individual scenarios using the modules decentral heating supply, district heating economic assessment and district heating supply dispatch, the respective results of the modules can be copied into the corresponding sheets of the document. Here three scenarios for the polish city Tomaszów Mazowiecki are evaluated.
As the CM Dec. Heating supply only calculates individual building classes, these must first be combined to an entire building stock of the area under investigation. This can be achieved by using the provided template. TODO
Then the desired scenarios can be entered (copy data into the corresponding columns)
The next step in building the whole area scenarios is to choose the scenarios of the district heating grids. This is done by pasting the output data from the CM DH economic assessment in the corresponding sheet. Here once again, paste the data for your scenarios to the corresponding columns.
The last bit of data needed are the scenarios for the supply of the district heating network. These data are obtained through calculating it with the DH supply dispatch module. Also, copy your results from that module to the corresponding scenario in the sheet DH supply dispatch. Please note hear, that you must copy in two parts of the results. After running the DH supply dispatch module, the first one is provided through export indicators and the second one through switching to the tab graphic and clicking on export graphs at the very bottom.

After copying the individual data, the compiled scenarios can be examined in the Sheet final table. On the one hand there is a table showing the exact results and on the other hand you can find some graphs on the right side.
Giulia Conforto and David Schmidinger, in Hotmaps-Wiki, CM-Scenario-assessment (September 2020)
Argentinierstrasse 18/10
A-1040 Wien, Austria
* Energy Economics Group - TU Wien
Institute of Energy Systems and Electrical Drives
Gusshausstrasse 27-29/370
1040 Wien
Copyright © 2016-2019: Giulia Conforto and David Schmidinger
Creative Commons Attribution 4.0 International License
This work is licensed under a Creative Commons CC BY 4.0 International License.
SPDX-License-Identifier: CC-BY-4.0
License-Text: https://spdx.org/licenses/CC-BY-4.0.html
We would like to convey our deepest appreciation to the Horizon 2020 Hotmaps Project (Grant Agreement number 723677), which provided the funding to carry out the present investigation.
View in another language:
* machine translated