not logged in | [Login]
Disclaimer: The explanation provided on this website (Hotmaps Wiki) are indicative and for research purposes only. No responsibility is taken for the accuracy of the provided information, explanations and figures or for using them for unintended purposes.
Data privacy: By clicking OK below, you accept that this website may use cookies.
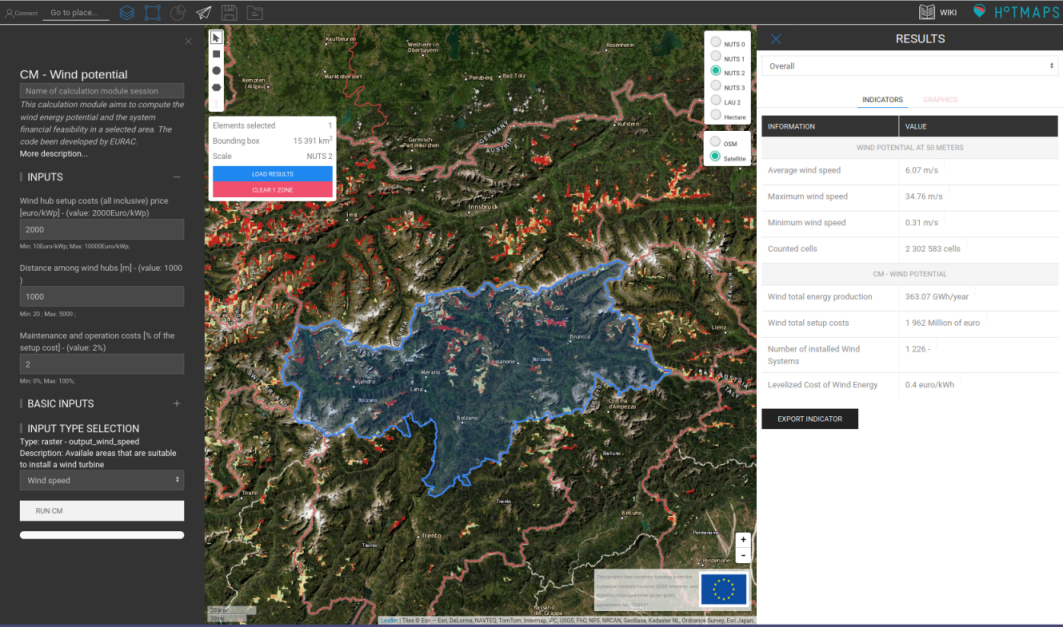
This module calculates the wind energy supply potential in a selected area. Inputs to the module are a raster file with the average wind speed and the technical specification of the wind blade and turbine.
This module assess the wind energy that might be generated by a wind turbine with a yearly, monthly and hourly resolution. The module estimated the number of turbines that might be installed in a predefined area.
Input layers and parameters are:
Output layers and parameters are:
The methodology used by the CM is to used the area selected by the user. The default areas are the areas identified in the wind potential layers that considered only areas with low or sparse vegetation, and bare and burnt areas (classes from 3.2.1. to 3.2.4. and 3.3.3., 3.3.4. of Corine Land Cover - CLC), these areas has been further filtered based on the following excluding criteria:
The CM use the user defined distance among the hubs to create a grid of potential hubs in the selected areas. Based on the number of wind turbine that might be potentially installed, based on the main characteristics of the wind system, height and technical specifications the module compute the energy that can be produced by the system.
The module obtain the monthly and hourly profile, computing the baricenter of the selected areas and query the RenewableNinja API, that provide the data from the MERRAv2 dataset.
Here you get the bleeding-edge development for this calculation module.

Pietro Zambelli, in Hotmaps-Wiki, CM-Heatsource-potential (September 2020)
This page is written by Pietro Zambelli*.
☐ This page was reviewed by Simon Pezzutto*.
* Urban and Regional Energy System Group - Eurac research
Institute of Renewable Energy
viale Druso 1
39100 Bolzano
Copyright © 2016-2020: Pietro Zambelli
Creative Commons Attribution 4.0 International License
This work is licensed under a Creative Commons CC BY 4.0 International License.
SPDX-License-Identifier: CC-BY-4.0
License-Text: https://spdx.org/licenses/CC-BY-4.0.html
We would like to convey our deepest appreciation to the Horizon 2020 Hotmaps Project (Grant Agreement number 723677), which provided the funding to carry out the present investigation.
Last edited by zarch, 2020-09-08 09:16:40